What is the average salary in 【Saitama】? We have put together a complete national comparison by age and by occupation.
2021-08-20
Jobs in Japan
Average Salary in Saitama Prefecture
Saitama Prefecture had a population of 7.33 million in 2018 and a nominal GDP of 23.4 trillion yen in 2017. Saitama has served as a commuter town for Tokyo since Japan’s postwar economic boom, so most of its population is concentrated in urban centers along major railways. Saitama has a thriving wholesale/retail and service industry, and one of Japan’s biggest clothing retailers Shimamura is based in the prefecture. It also has a big manufacturing industry, with one famous Saitama manufacturing company being Marelli Corporation.
・Saitama Average vs. National Average Annual Salary
The following table shows the average annual salary in Chiba Prefecture. The overall annual average is 4.785 million yen, and the average annual bonus is 798,000 yen.
| 2019 Saitama Ave. Salary | Overall | Men | Women |
| Annual (yen) | 4,785,000 | 5,324,000 | 3,765,000 |
| Monthly (yen) | 332,000 | 367,000 | 266,000 |
| Annual bonus (yen) | 798,000 | 920,000 | 568,000 |
| Average age (years) | 43.3 | 43.9 | 42 |
| Working population | 993,000 | 650,000 | 343,000 |
For comparison, the table below shows the average salary for all of Japan. The national average annual salary is just over 5 million yen, which puts Saitama below the Japan average. The same applies when we look at men’s and women’s salaries separately.
Saitama’s working population is around 993,000, which is relatively low for its overall population. For comparison, Ehime Prefecture, which has a similar population to Saitama (7.537 million), has a working population of 1.945 million, nearly twice as many as Saitama. The reason for Saitama’s low number of laborers is that many Saitama residents actually commute to Tokyo for work, where the pay is generally higher.
| 2019 National Ave. Salary | Overall | Men | Women |
| Annual (yen) | 5,007,000 | 5,610,000 | 3,880,000 |
| Monthly (yen) | 338,000 | 375,000 | 269,000 |
| Bonus (yen) | 951,000 | 1,111,000 | 652,000 |
| Average Age (years) | 43.1 | 43.8 | 41.8 |
| Working population | 22.18 million | 14.45 million | 7.73 million |
Saitama Average Annual Salary by Gender
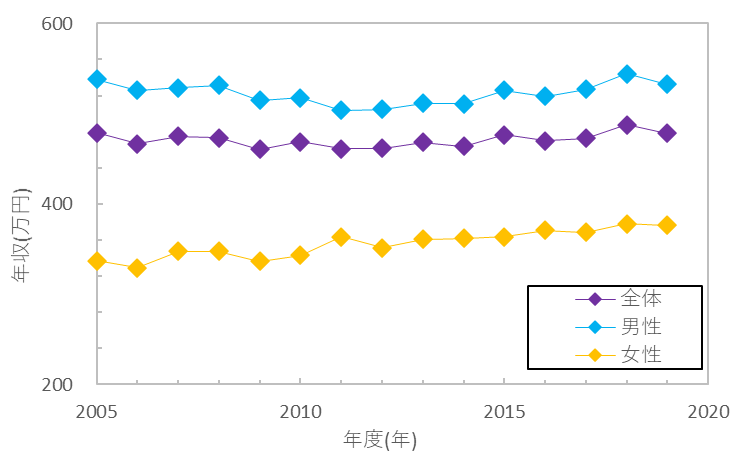
The following graph shows the average annual salary in Saitama Prefecture by gender for the 15-year period from 2005 to 2019. Looking at men’s wages, the 2008 Global Financial Crisis caused a significant drop from that year, but it mostly recovered by 2015. Overall, men’s wages in Saitama have basically hovered around the 5.2 million yen mark for the 15-year period.
On the other hand, women’s wages experienced a similar drop in 2008, but it recovered quite quickly and has generally been on a gradual rise ever since. Between 2005 and 2019, women’s wages experienced a higher increase compared to men’s wages. However, there is actually a large gender pay gap, with women earning just 63% of what men earned in 2005. This gap has narrowed down slightly in 2019, with the ratio increasing to 71%.

Saitama Average Annual Salary by Age Group
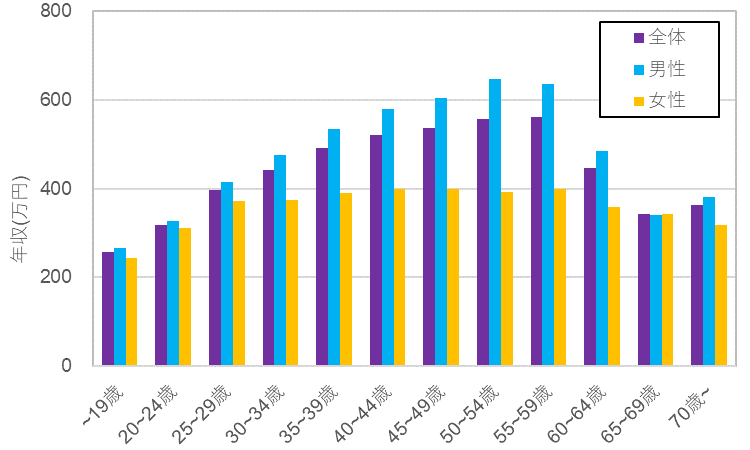
The following graph shows the average annual salary in Saitama Prefecture in 2019 by age group. We also give an analysis for each age group below.
Average Annual Salary for Workers in their 20s
Workers in their early 20s earn an overall average of 3.19 million yen annually, with a very small gender pay gap (women earn 95% of what men earn). In the late 20s, the overall average increases to just below 4 million yen, but the gender pay gap also starts to increase significantly.
Average Annual Salary for Workers in their 30s
In the early 30s, the overall annual average increases to 4.42 million yen, which is generally believed to be sufficient to raise a family. This increases further to 4.92 million yen in the late 30s. Men’s wages continue to increase in a linear fashion, but the rise in women’s wages virtually grinds to a halt from the early 30s, with women earning just 73% of what men earn by the late 30s. This is most likely due to the Japanese custom of women leaving their jobs to get married and raise children.
Average Annual Salary for Workers in their 40s
From the early 40s, men’s annual wages start to taper off slightly, reaching just over 6 million yen in the late 40s. On the other hand, women’s wages remain basically flat through to the 40s, with the average at just under 4 million in the late 40s. The gender pay gap continues to increase, with women in their late 40s earning just 66% of their male counterparts.
Average Annual Salary for Workers in their 50s
The annual salary for both men and women peaks in the 50s, with men earning 6.47 million yen in the early 50s, and women earning 4.01 million yen in the late 50s. From the 60s and onwards, workers approach their retirement age, and men’s wages experience a significant drop, while women’s wages see a more gradual decline.
Average Entry Level Salary in Saitama
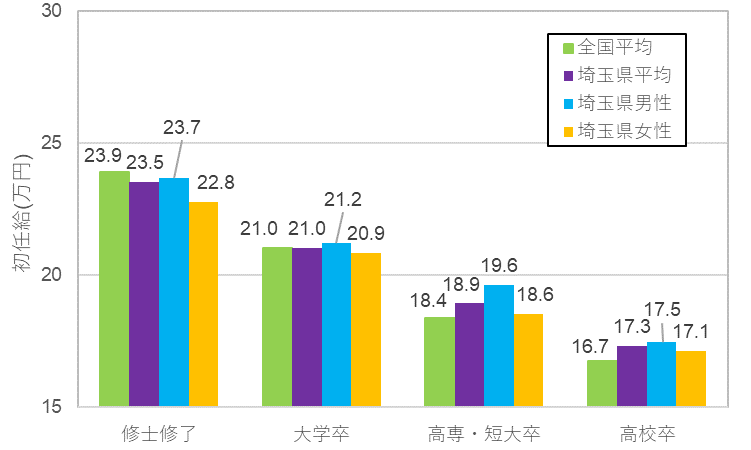
The following graph shows the average entry-level salary in Saitama Prefecture by educational attainment. Entry-level salaries in Saitama are generally equivalent with the national average, with the average for high school and junior/technical college graduates edging slightly higher, and the average for master’s degree holders just slightly under. Considering its proximity to Tokyo, one might think that salaries in Saitama are on the high side, but in actuality, they are more or less on par with the overall average in Japan.
Saitama Average Annual Salary by Industry
The table below shows the average annual salary in Saitama Prefecture by industry for the year 2019. Overall, there are no industries that are outstandingly high or low in terms of salary. The industries with the highest rank are Wholesale and Retail Trade, Compound Services, and Services (all of which are 6th by prefecture). The industry with the lowest rank at 33rd is Electricity, Gas, Heat Supply and Water, though its average salary of 5.713 million yen is quite high relative to the overall national average salary.
The industry with the highest average annual salary in Saitama is Scientific Research/Professional/ Technical Services, with an average wage that is over 1 million yen higher than the Saitama overall average. This is something to consider if you are looking to earn a high salary in Saitama.
In contrast, the industry with the lowest average annual salary is Accommodations/Food and Beverage, with an average wage that is well below the overall average in Saitama. Nevertheless, Saitama ranks 10th by prefecture in this industry, so it is arguably still on the high side. Other industries with a relatively low average annual salary in Saitama are Transport/Postal Activities and Living-related/Amusement Services.
| Industry | Average annual salary | Rank |
| Mining and Quarrying of Stone and Gravel | 4,849,000 yen | 9 |
| Construction | 5,083,000 yen | 11 |
| Manufacturing | 4,467,000 yen | 18 |
| Electricity, Gas, Heat Supply and Water | 5,713,000 yen | 33 |
| Information and Communications | 5,120,000 yen | 18 |
| Transport and Postal Activities | 3,690,000 yen | 21 |
| Wholesale and Retail Trade | 4,581,000 yen | 6 |
| Finance and Insurance | 5,215,000 yen | 21 |
| Real Estate and Goods Rental/Leasing | 4,303,000 yen | 10 |
| Scientific Research, Professional, Technical | 5,847,000 yen | 10 |
| Accommodations/Food and Beverage | 3,370,000 yen | 10 |
| Living-related and Amusement Services | 3,627,000 yen | 10 |
| Education, Learning support | 5,613,000 yen | 12 |
| Medical, Health Care, Welfare | 4,339,000 yen | 8 |
| Compound Services | 4,856,000 yen | 6 |
| Services, n.e.c. | 3,680,000 yen | 6 |
Summary
Saitama is one of the most populous prefectures in Japan, and part of it lies in the Greater Tokyo Area. This may give some people the impression that Saitama has high average salaries. But when we look at the overall numbers, Saitama wages are actually relatively low. This is likely due to the fact that a significant number of Saitama residents commute to Tokyo to work.
出典:令和元年 賃金構造基本統計調査 結果の概況|厚生労働省